As we head into the home stretch of ’22, startups around the world are beginning to build their budgets for next year. Top of mind for everyone right now, of course, is what will ’23 bring in terms of interest rates, capital markets and broader macro conditions. Nearly every Board will be pushing their founders to focus on efficient growth — where burn and runway are just as important as top-line growth.
Creating the top-line goal is the easy part. If you are a Series A or Series B B2B startup, you probably are shooting for something like 2–3x yoy growth. But it’s the supporting budget to attain that plan (and ensuing investments in OPEX) that is the real challenge to map out. Overspend and you could find yourself in a troubling cash position; in an environment punishing to high burn businesses no less.
I work mostly in fintech where transactional businesses models (e.g. payments, lending, last-mile logistics, etc) are common. If you are a founder with a transactional model, budgeting for next year will be even more tricky than what your SaaS peers have to do in their planning process for ‘23.
This post will explore why that is and what you can do about it. TLDR, if you want to skip over the why part and just go directly to the recommendations, here they are:
- Build in monthly minimums where you can
- Understand your customer ramp process
- Allocate product and engineering resources to reducing costs
- Hone your demand forecasting
- Budget carefully with clear stage gates and monthly check points
- Downplay months where you beat and sweat months you miss
- Be strategic about the timing of your next round
- Consider extending runway with alternatives to equity (but proceed with caution)
Implications of a Transactional Business Model
Transactional businesses have a variety of nuances that make them more challenging to budget for vs a business with a SaaS model. The first, and most obvious difference, is that planning out the top-line on a month-to-month basis for the transactional business is inherently harder.
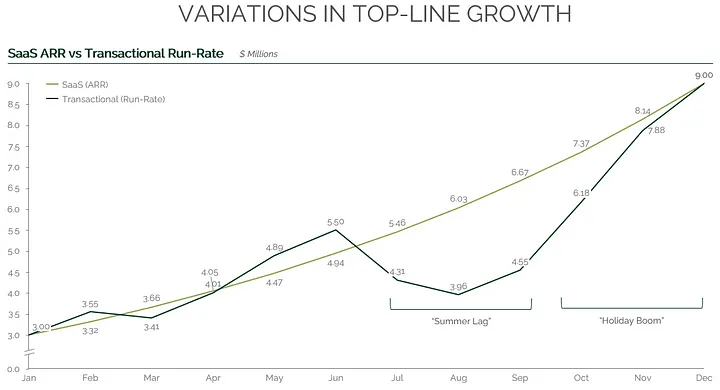
Let’s take two growth-stage Series B companies that want to 3x growth from ’22 to ’23. The SaaS business wants to go from 3M of ARR to 9M of ARR and the transactional business wants to go from 3M of revenue run-rate to 9M of revenue run-rate — enviable growth for any Series B company! (Please note there is a key distinction between “ARR” and “run rate,” see here.) The ’23 top-line plans of the two businesses could well look something like this:
Both companies go from 3M to 9M but getting there is quite different. The monthly growth for the SaaS business is mostly “smooth” and predictable. If the business is working, there can be a high degree of precision to monthly and quarterly forecasting. Every month net new ARR is added to the existing ARR base and the company scales as a function of more marketing and sales resourcing.
The transactional business is a bit “choppier” and a lot less predictable, as every month is, in a sense, completely unknown. The transactional business can’t necessarily bank on last month’s revenue (it’s not contractually recurring), in order to continue growth. There is also usually some form of seasonality with transactional businesses. In the payments/ ecommerce world, for example, that seasonality takes the form of a summer slowdown followed by a holiday boom.
Next, let’s look at the impact of the two models on burn and runway assuming both companies started with a similar starting cash position ($30M on Dec 31st ’22) and have the same OPEX budget plan (ie they plan to spend the same amount on hiring, G&A, etc.)
By the end of the year, the ending cash position of the transactional business is $2M less and the business has 5 months less of runway!

In this example, there are two reasons why the transactional business ends the year with 5 months less of runway, despite the two businesses budgeting for the same OPEX spend and achieving the same top-line goal:
1) The SaaS business will generate $0.5M more in GaaP revenue for ’23 than the transactional business (+10% more). This is mostly a result of the seasonal dip in Q3. Note that even though the transactional business has a faster growth rate in Q4, it generates 6% less revenue than the SaaS business in that quarter (“deeper hole to dig back from.”)
2) The SaaS business will generate $2M more of gross profit (+43% more). The transactional business has lower gross margins than the SaaS business. In this example, we have assumed typical 80% gross margins for the SaaS business vs 50% for the transactional business — transactional businesses almost always have higher COGS than SaaS businesses (e.g. processing fees, cost of capital, delivery costs, etc.)
The two points above mean the transactional business has fewer real dollars coming in than the SaaS business to offset the same amount of OPEX. Ceteris paribus, transactional business will almost always burn more than SaaS businesses.
The other challenge for the transactional business, as a result of the top-line volatility, is that the monthly burn is also much more variable. Continuing with our example, for the SaaS business, the OPEX scales each month along a predictable growth pattern allowing the burn to stay flat at 1M per month.
The transactional business, however, has burn that varies each month with months like August and September ~25% higher. And if one-month misses plan it can be hard to know what the next month will bring. You could end up being on a burn spiral with each month successively worse or, conversely, cut burn prematurely only to see growth spike and be unable to keep up with customer demand.
Here’s a view of the P&Ls of these two company’s budgets by month. For simplicity, I’ve assumed the negative EBITDA equates to burn in both examples.

What You can do About It
At this point you might be tempted to wish you could go back in time and start building a SaaS business (no doubt it was an incredible invention of the 2000s!) But don’t lose hope here, transactional founder, there are many great examples of successful transactional fintechs (e.g. Stripe, Square, Affirm, Adyen, Coinbase, etc.) All of which navigated the growth phases of scaling a transactional model before maturing into incredible companies.
Here are eight things to consider while building your budget for ’23 to avoid potential cash/ runway traps.
1) Build in monthly minimums where you can. Increasingly, transactional fintechs are using this as a tool to combat seasonality and runway issues. Typically, these are structured as a minimum “platform fee” with monthly overages. Having these monthly minimums creates some base-line revenue expectation from which to build the conservative budget case. Monthly minimums also have the added benefit of helping to mitigate against dollar-based churn (and probably logo churn as well given they require a real commitment from the customer.) The key here is to do this as early as possible in your evolution vs trying to get customers to sign up for minimums 2 years in.
2) Understand your customer ramp process. SaaS businesses often have a customer onboarding phase and may have some ramp time as well. But transactional businesses almost always have a longer and less predictable ramp period depending on timing of roll-out and the idiosyncrasies of end merchant or consumer dynamics. If you are a payments business for example and rolling out your payments offering to multiple store locations with a single brand, it will take time to roll out to all locations AND each location will take time to ramp to full utilization. Add the complexity of seasonality and there can be a ton of uncertainty when building next year’s budget. Understanding how (and when) your customers ramp can make this more straightforward.
3) Allocate product and engineering resources to reducing costs. Having a good grasp of your unit economics, whether you are a SaaS or transactional business is always really important. But transactional businesses have an even greater opportunity to use automation to reduce certain costs that impact their gross margins and profit margins than their SaaS peers. In the fintech world, as you scale your business, R&D resources could be used to automate areas that start of as very manual in the earlier stages. Areas like customer support, delivery routing, fraud prevention, collections recovery, order tracking, etc, can all be automated over time leading to reductions in COGS and OPEX that ultimately improve margins and lower burn.
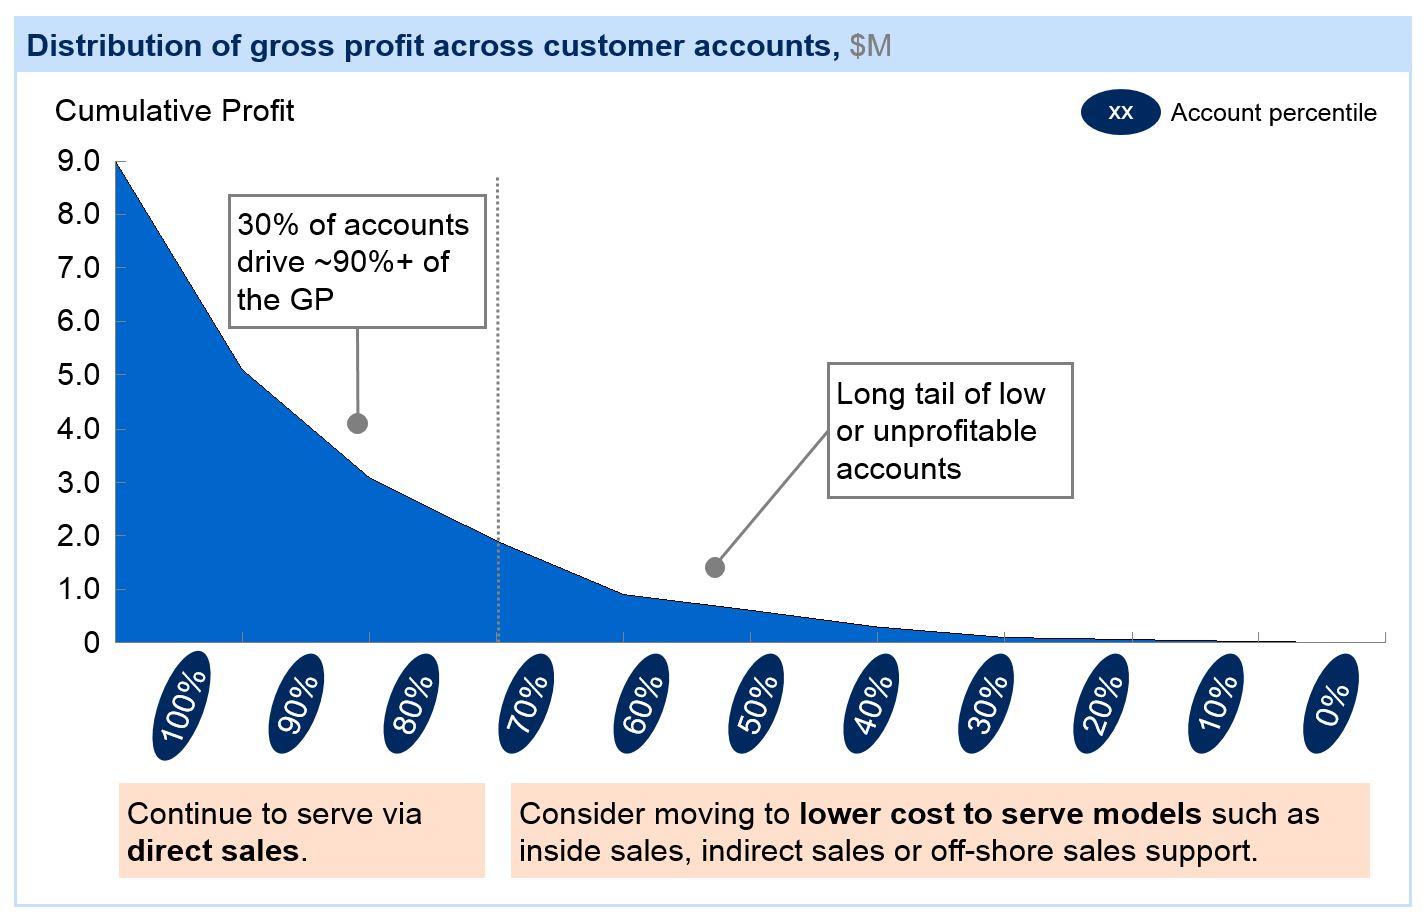
4) Hone your demand forecasting. As seen in the example above, so much of the monthly burn depends on whether top-line objectives are accomplished or not. Transactional businesses have internal factors (e.g. sales rep productivity) that certainly matter but macro factors also play a big role (ecommerce/ consumer buying behavior, interest rates from debt providers, delivery-related costs like fuel, etc.) Having your account management/ customer success teams tracking the top-line results of your top 5–10 accounts is a particularly important indicator as churn or volume declines in that segment can really impact the ultimate burn numbers. Demand forecasts for transactional businesses need to pull in all of these relevant variables and adjust the models rapidly to changing environments.
5) Budget carefully with clear stage gates and monthly check points. Given the unpredictability of transactional businesses combined with today’s tepid fundraising environment, transactional businesses need to be even more conservative when allocating funding to teams and initiatives than their SaaS peers. Projects and hires all need to have very clear ROI and rational. And if your monthly top-line goals are not being realized, especially 2–3 months of successive 20%+ misses, freezing or scaling back on spending is likely the right move until you figure out why the results aren’t showing up. There is nothing worse than throwing precious equity dollars at a product or gtm motion that is fundamentally broken.
6) Downplay months where you beat and sweat months you miss. With transaction businesses, any month (or even set of months) should not be viewed as indicative of the next month. In fact, monthly performance should really be compared to the same month last year. So don’t up the spend just because one or two months came in favorable. It could be temporary and later months could underperform. Similarly, missed months should be viewed with a high degree of concern. As they rack up throughout the year, the burn will likewise rachet up as well and could be severe if the performance worsens further during expected boom months without cost rationalization.
7) Be strategic about the timing of your next round. Transactional businesses have periods with lulls (e.g. summer months) and booms (e.g. holiday season). Investors intrinsically know this, and it may seem silly that seasonality isn’t discounted or normalized. It may in fact be discounted, nonetheless, don’t underestimate the psychological impact of timing on the success of your raise (especially in this environment where you need every edge you can get!) The top-line optics for an ecommerce enablement raise, for example, typically look at lot better if that raise is done in January vs July. If you can, find ways to manage your cash and stretch out your runway such that you can raise right after more favorable time periods.
8) Consider extending runway with alternatives to equity (but proceed with caution). Runway extension beyond equity used to be challenging to find for non-SaaS businesses. However, this has changed in the last 3–5 years as venture debt lenders (both bank and non-bank) have increasingly warmed up to alternative business models. The revenue-based-financing space (companies like Clearco, Pipe, Capchase, etc) has also begun to offer an intriguing alternative for runway extension in the form of non-dilutive financing. Just remember debt must be repaid at some point and can come with plenty of strings attached.
Transactional businesses have the potential to build incredible products and generate tremendous amounts of enterprise value. But managing cash and building budgets that make financial sense is no easy task, particularly in the early stages of growth. With a little bit of foresight and a whole lot of sweating the details, you can ensure your 2023 budget leaves you in a very strong cash position to realize your company’s ultimate vision.
***
I’d like to thank Alex Kurland, Angel Pena, Anoushka Vaswani, and Dimitri Dadiomov for reviewing early drafts of this piece and providing some quality feedback along the way.