In the venture world, there are typically two ways VCs successfully exit the companies they invest in: (1) via IPO or (2) through acquisition by a larger tech company (think Google, Microsoft, etc.,). Of these two methods, an M&A exit has historically been more common. Nonetheless the literature within the venture community about why large tech firms acquire the specific targets they snap up is sparse. It seems odd that while ‘the acquisition’ is the main goal for most of the venture community, many VCs spend little to no time thinking about investing from the perspective of the firms doing all the acquiring.
This semester, I took Columbia Business School Professor Raul Katz‘s course on Developing Strategies for High Tech firms. In the process, I wrote my final paper on this very subject. The focus of the paper was to understand the recent (last 3 years) M&A activity of four of the largest global tech companies: Apple, Facebook, Google and Microsoft. Specifically the paper analyzed the implications the M&A activity of these four companies (and others like them) has for early stage VCs focused on investing in tech companies.
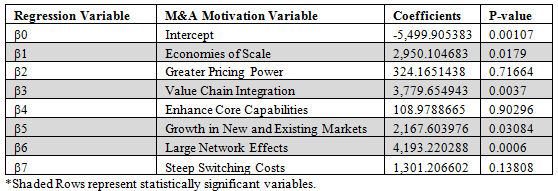
In building towards a hypothesis around the motivations for M&A activity, I examined the 7 motivational variables displayed in the table below. I focused solely on operational motivators and excluded non-value maximizing motivators such as management hubris or financial synergies like the desire to reduce the weighted average cost of capital (WACC). The rationale behind this focus is that operational synergies are the most relevant and identifiable variables for VCs to focus on as they think about M&A as an exit option. Operational synergies are also: specific, repetitive (allowing for pattern recognition), have predictive power and can be used to build an investment thesis.
The shaded rows represent new variables previously not looked at in the existing literature. I used S&P Capital IQ as well as a variety of analyst reports and news articles (VentureBeat, TechCrunch, etc.,) to populate the data used in the regression model.

The results of the regression analysis are displayed below:
Premium Paid = -$5,500 + $2,950(β1) + $324(β2) + $3,780(β3) + $109(β4) + $2,168(β5) + $4,193(β6) + $1301(β7)

There are several characteristics of the regression worth pointing out. First, the intercept (β0) is negative, which limits the full application of the regression equation. This is likely due to a small sample size and data that is not normally distributed. Because of this negative intercept, we cannot make a direct dollar connection between each M&A motivation variable and the premium paid by the acquiring firm. That being said, we can make some relative observations based on the size of each beta coefficient. Additionally we can make some important observations regarding statistical significance. As seen in the exhibit above the four M&A motivation variables that were statistically significant include: economies of scale, value chain integration, growth in new and existing markets and large network effects. The remaining three variables are not statistically significant according to our model.
The results can be broadly bucketed into B2C variables and B2B variables—although there is certainly some overlap. On the B2C front, unsurprisingly, tech firms like Apple, Facebook, Google and Microsoft place the largest premiums on startups with large network effects. Acquiring companies like Instagram, WhatsApp and Skype allows these firms to essentially acquire a massive customer base with a large customer life-time value. Because of the large network effects, these customers are unlikely to switch to substitutes. Big tech firms can then monetize these acquired customers over a long period of time as well as cross-sell products and services on their existing platforms.
According to our regression output, these big tech firms also place an important (though not nearly as large) premium on B2C companies that allow them to grow in new and existing markets. B2C companies like Snaptu (a mobile platform for feature phones in developing nations acquired for $70 million) and Oculus VR (a virtual reality and gaming device company acquired for $2.3 billion) allow big companies like Facebook to enter new markets—whether geographic, customer-segment specific or newly emerging industries.
When it comes to B2B acquisitions, the M&A model provides evidence that large tech companies place a heavy premium on value chain integration and economies of scale—both means to maintain a competitive advantage. Apple’s acquisition of semiconductor company Anobit Technologies for $400 million is a great example of value chain integration. Apple has slowly been moving away from hard drives to flash memory beginning with the iPod and most recently its MacBook Air. Flash memory allows Apple’s products to be thinner and run on less power. Acquiring Anobit allowed the firm to acquire the hardware component needed to complete value chain integration and transition fully from hard drives to flash memory chips.
Though not as important as value chain integration from a relative perspective, large tech companies also consider economies of scale when acquiring B2B companies. Within that realm, companies that provide a service or toolkit that enable a bigger tech company to take advantage of scale economies are also often worth acquiring. Microsoft’s acquisition of Pando, a file-sharing technology that works peer-to-peer like bit-torrent, is a great example of this. Pando’s technology can be applied to Microsoft products like Xbox and Windows Phone App Store, to reduce costs in these divisions and enable Microsoft to take advantage of its economies of scale.
For full analysis of the results of this study as well as a discussion of the implications for VCs, please email the author.