Summary:
- While the 2000s and 2010s gave birth to many B2B SaaS greats, the 2020s will usher in a new wave of winners that have far more heterogenous business models.
- In the pure SaaS world, the startup and venture community developed many great “rules of thumb” for understanding how to operate and value these businesses.
- Understanding and valuing hybrid B2B businesses, however, is much more complex.
- There are at least 4 different types of mixed-revenue models that include various mixtures of hardware, software, services and financial services revenue.
- Valuing hybrid business models requires using a weighted average approach — I will present a framework to do this and provide a few examples.

As we begin to reach a certain level of maturity among cloud applications, it has become increasingly clear that we are now moving beyond the first wave of pure SaaS players that came to define the 2000s and 2010s and produced big B2B wins like Salesforce, Atlassian, Zoom, Hubspot and many others. In more recent times, we’ve migrated from this homogenous SaaS world to a more complex world of hybrid businesses, which generate different types of revenue in their quest to build enduring value. This, of course, has played out in many industries beyond software. Costco, for example, was one of the OGs here with its membership subscription fee + item price revenue model.
In some cases, hybrid models are an evolution over time: an early stage company starts with a wedge software product that customers love and then evolves in the growth stages to include additional features that drive new sources of revenue like lead gen fees, payment transaction revenue, lending revenue, etc. This is the story of Shopify, which originally generated subscription revenue for access to its ecommerce software tools before evolving to include additional revenue sources like payments, transaction fees from apps in its app marketplace and other “store-front fees” like domain registration.
In other cases, mixed revenue streams can happen right from the get-go. Our portfolio company, Sendoso, has operated as a SaaS + Transaction revenue-model from Day 1. Customers pay a subscription fee for access to the platform and a set of integrations into the sales, marketing and customer success stack. Additionally, they then pay a separate transaction fee for physical or virtual items sent through the platform to current customers or prospects.
Shopify and Sendoso are certainly not the first businesses with a hybrid model, nor will they be the last. As we enter a world where mixed-models become more common, the two questions then become:
(1) What will these mixed-models look like?
(2) How do founders think about valuation in the absence of less established rules of thumb?
***
SaaS: Established Rules of Thumb
But before we get to answering these two questions, it’s helpful to review the basics behind the most successful B2B business model of the last 2 decades: pure SaaS. It is well understood that the two most important financial drivers impacting the valuations of public SaaS companies are, first and foremost, growth rate and second, to a lesser extent, gross margin (though the latter may increase in importance given the recent times.) Below is a view from a basket of SaaS businesses. For illustrative purposes, this is a snapshot taken from February, before the market volatility caused by coronavirus.
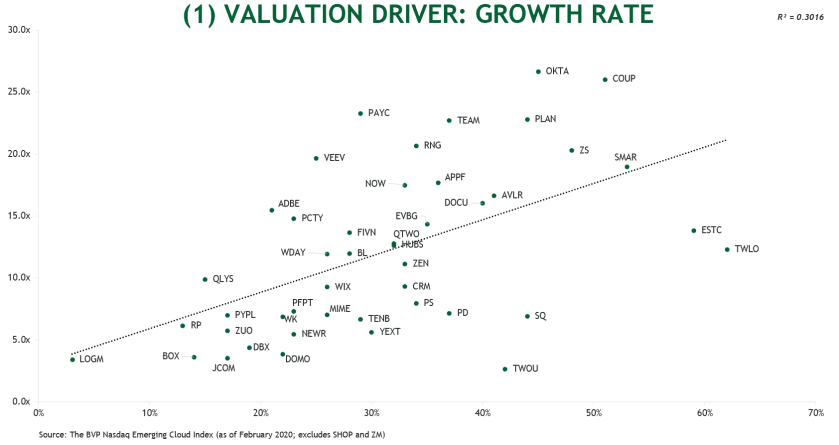
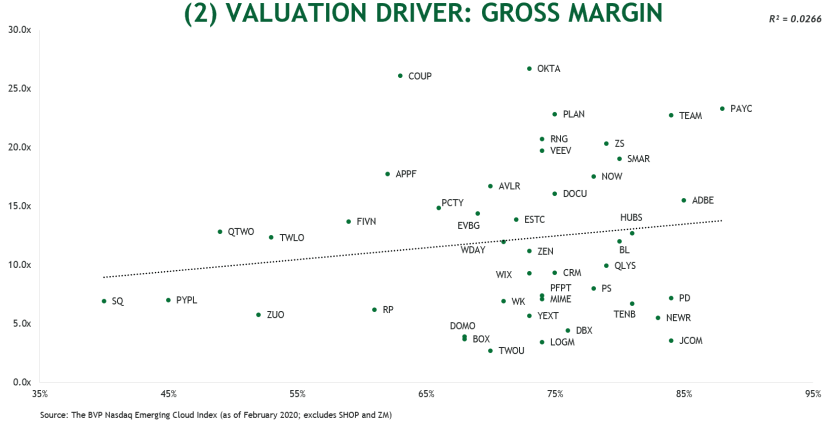
To sum: most public SaaS businesses north of 100M ARR that are growing 30–40% with 70–80% gross margins can command a multiple of ~10–12x on the public markets (or at least they could pre-coronavirus; we will know over the coming months whether the current deflation is temporary or here to stay.)
In the “earlier” venture to growth-stage world, this translates into a number of operating levers that are well understood. This post is not meant to be a review of the literature on SaaS metrics but there are some great resources for further reading on these topics, which I’ve included in an appendix at the end.
***
Mixed Revenue Models: Forging into Newer Territory
In today’s world, we are seeing a notable uptick in mixed revenue models. B2B companies chasing additional growth opportunities are realizing that once they have achieved clear customer lock-in with one product, maintaining a high growth rate and expanding their TAM, can often be accomplished by cross selling other ancillary products — many times with different types of revenue. This has taken the shape and form of at least four playbooks:
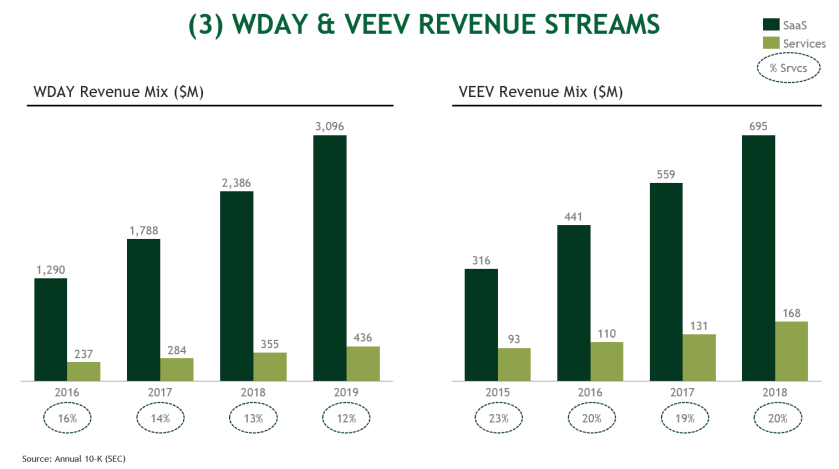
(1) Software + Services
Selling services in addition to software is of course nothing new. In the on-prem/ perpetual license world, professional services were essential to the delivery and implementation of enterprise software. In the cloud application world, professional services typically play a similar role when selling to large enterprises (e.g. the customer base has a lot of F500 customers.) These customers typically require broad integrations, time-consuming security audits and a white-glove experience. While necessary and incremental to top line, services revenue is broadly viewed as less valuable than SaaS revenue.
Workday and Veeva are two great examples of companies that have continued to excel at growing both SaaS and Services revenue. To this day both companies still have a very significant (and growing) services revenue stream (i.e. hundreds of millions of revenues annually) in addition to the SaaS revenue.
(2) Bundled Financial Services
A common theme we are seeing, especially within FinTech is the bundling of financial services. Typically, a business will find initial PMF around a single product with a single source of revenue — for example payments. Overtime, the business will offer its customers additional financial products generating additional revenue from things like lending, referrals to 3rd parties, % of AUM, interchange and a range of other revenue models.
Stripe is a great example of a company that has executed very well on this playbook. In “Act One,” Stripe created tremendous lock-in around it’s payments platform by enabling companies to process card charges on a 2.9% + $0.30 per transaction basis. But as the company evolved over time they built new products with different revenue models (see here for more info):
- Additional Payments Features: International payment (1% for international cards), 3D Secure authentication ($0.03 per authentication attempt), ACH (0.8% with a $5 cap)
- Billing: Recurring revenue (0.5% on recurring charges)
- Radar: Fraud protection ($.05 per transaction), Chargeback protection (0.4% per transaction)
- Terminal: In-person card processing (2.7% + $.05 per card charge), Card readers ($299 for a Verifone device)
- Atlas: Starting an LLC, opening a bank account, issuing founder stock, etc. ($500 one-time fee)
- Premium Support: dedicated CSM, help with critical issues ($1800 / month)
- Issuing (still in Beta): creating and managing virtual/ physical cards ($.10 per virtual card; $3 per physical card)
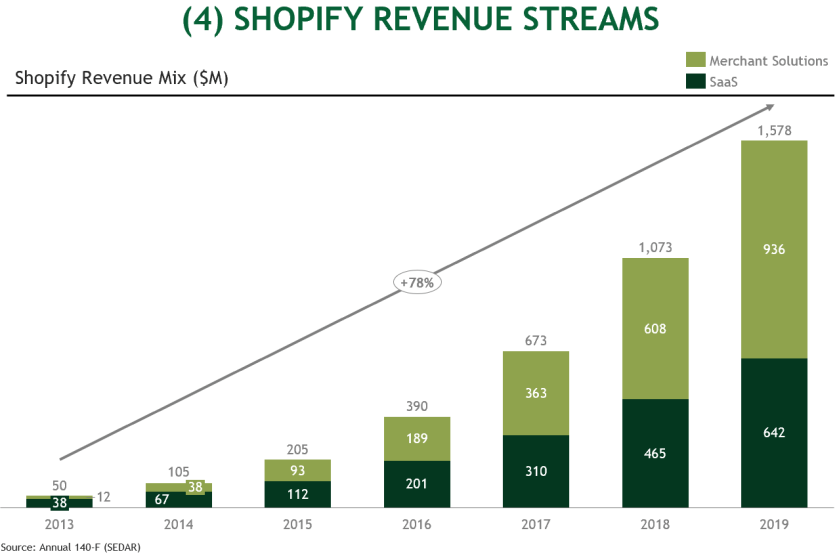
(3) Software + Bundled Financial Services
But FinTechs are not the only players to bundle financial services. We have begun to see a number of SaaS businesses use application software as an entry point, create lock-in with recurring revenue and then embed a host of other financial services directly into the platform. In doing so, these businesses can generate incredible momentum, widen their TAMs while also maintaining a broad base of stable recurring revenue.
No one has executed better on this playbook than Shopify, which has grown to over $70B in market cap (accelerating through covid-19 no less) and has commanded a revenue multiple of over 30x at certain times. Shopify’s SaaS business gives merchants access to its ecommerce platform + tools to build storefronts; while it’s Merchant Solutions business (i.e. bundled financial services) generates revenue from customers via lending, payments, shipping and referral fees. In the early days, software was the main driver of revenue growth, but over time the financial services have accelerated in a very impressive way.
(4) Software + Bundled Financial Services + Hardware
The final hybrid model we have seen is effectively #3 above with the addition of hardware. Hardware stand-alone businesses, of course, are notoriously difficult and very hard to operate successfully at scale. But hardware combined with the margins of SaaS and the extended reach of bundled financial services can be a very powerful business. Toast is a great example of a company that has successfully leveraged all three revenue sources to build a very effective business in the restaurant vertical (see here for more info):
- SaaS: menu management, analytics & reporting, inventory management, team management, etc. ($75 per terminal/month)
- Hardware: vertical-specific android-based terminals (range of prices based on terminal type and size)
- Bundled Financial Services: Payments, loyalty & rewards, gifting, payroll administration (pricing varies by type of product)
***
Hybrids: A Weighted Average Approach to Valuation
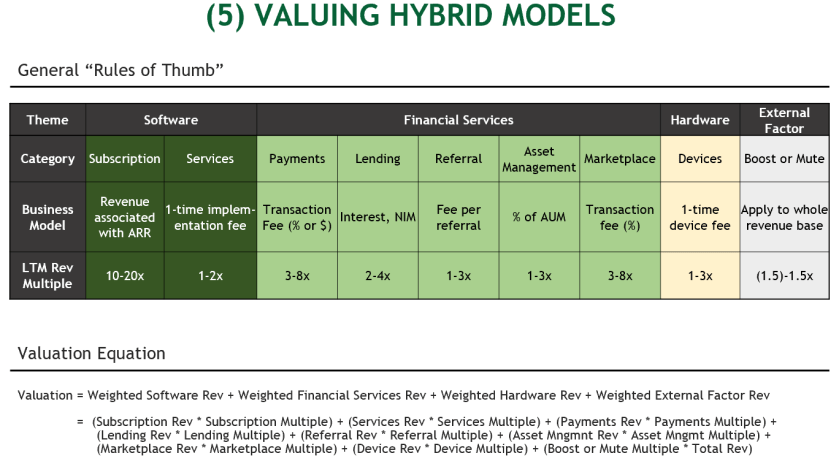
Mix-model business are thriving and clearly here to say. But valuing high-growth hybrids is more challenging in the absence of the simple heuristics developed for the SaaS world. My suggestion on how to value these companies in the early/growth stages (~$2-$20M in revenue) is to use a weighted average revenue multiple approach. In other words:
1. Break down the business into its various components based on where it is today from a net revenue perspective
2. Apply specific multiples to each of the distinct parts of the business based on general heuristics associated with underlying characteristics like growth rate, margin profile, usage frequency, etc
3. Add in a “boost” or “mute” for external factors like TAM, LTV, retention, depth of competition, customer profile, how the revenue mix may shift over time, etc. This is a big part of the “magic”
4. Use a Sum-Product function across revenue and revenue multiple
Below is a table that illustrates the valuation equation and some general “rules of thumb” as guidance:
Example One
SMB SaaS business that helps its customers make payments to vendors and also generates a lead gen fee for referring its customers to new vendors. On the SaaS side (SMB so self-serve and no services), the business seems to be in the early innings of a strong growth trajectory (3x.3x.2x.2x.2x) having grown from 2M ARR to 6M ARR in the last year ($4M in revenue associated with the SaaS ARR.) The business did an additional $4M in payments revenue and $2M in lead gen revenue; for a total of $10M in revenue. The company operates in a large, mostly greenfield TAM and, over time, the payments revenue will grow to be the clear leading driver of revenue while the lead gen revenue becomes less relevant.

As illustrated above, this is a SaaS + Bundled Financial Services model consisting of subscription revenue, payments revenue and lead-gen revenue. In addition, we applied a relatively high Boost of 0.75 to account for the strong growth profile and large/greenfield TAM; somewhat muted by the lower-multiple payments revenue being the predominant driver of long-term growth. The weighted multiple is ~9x.
Example Two
The second example, a POS terminal business that operates in corporate cafeterias, is also doing $10M in revenue. In addition to charging for the terminals, the company charges an installation fee for set up, generates payments revenue from processed transactions and takes a cut of revenue from any 3rd party apps installed on its devices. However, this business is slower growth due to longer sales cycles (grew < 40% last year.) The company also faces fierce competitors like Square, Toast and Revel.
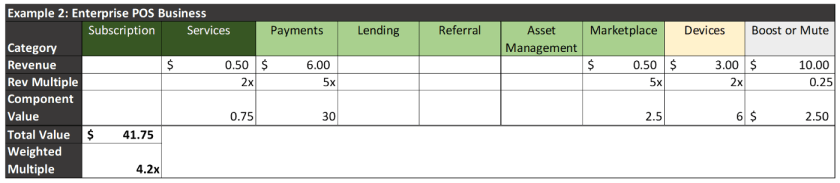
As noted above, this is a Software + Bundled Financial Services + Hardware company. In addition to being comprised of different components than the company in example 1, this is also a lower growth business with 2–3 dominant competitors in market. As such, we added a lower boost scale and the weighted multiple ends up being ~4x.
Template: If you’d like to access these examples, and maybe run a few scenarios yourself, I’ve included a google sheet (here) where you can give it a try. Always open to suggestions on how to improve this so feel free to send my way.
***
Final Thoughts
We’re moving into a more heterogenous world, where mixed-model revenue businesses will continue to emerge and thrive. As this new class of companies grow and thrive, founders and investors will need to better understand how to operate, grow and (ultimately) value these businesses. In some cases, it may make a lot of sense to start by valuing a company with one approach (e.g. SaaS) and then layer in other approaches over time as the company evolves. But taking a weighted average approach to valuation in conjunction with a bit of good judgement is a great way to understand valuation for these hybrids.
Appendix: Further Resources on SaaS
Overall SaaS Frameworks:
Growth Rate:
Retention
Sales Productivity / Efficiency
***
If you have a different approach, I’d love to hear about it (@MrAllenMiller!) I’d also like to thank Kris (@rudeegraap), Dimitri (@dadiomov), Ian (@iankar_) and Sheel (@pitdesi) for their contributions to this piece.